
Dinex Latvia: From Total Consumption to Machine-Level Insight
How an exhaust systems manufacturer replaced assumptions with measured data using AdvanGrid
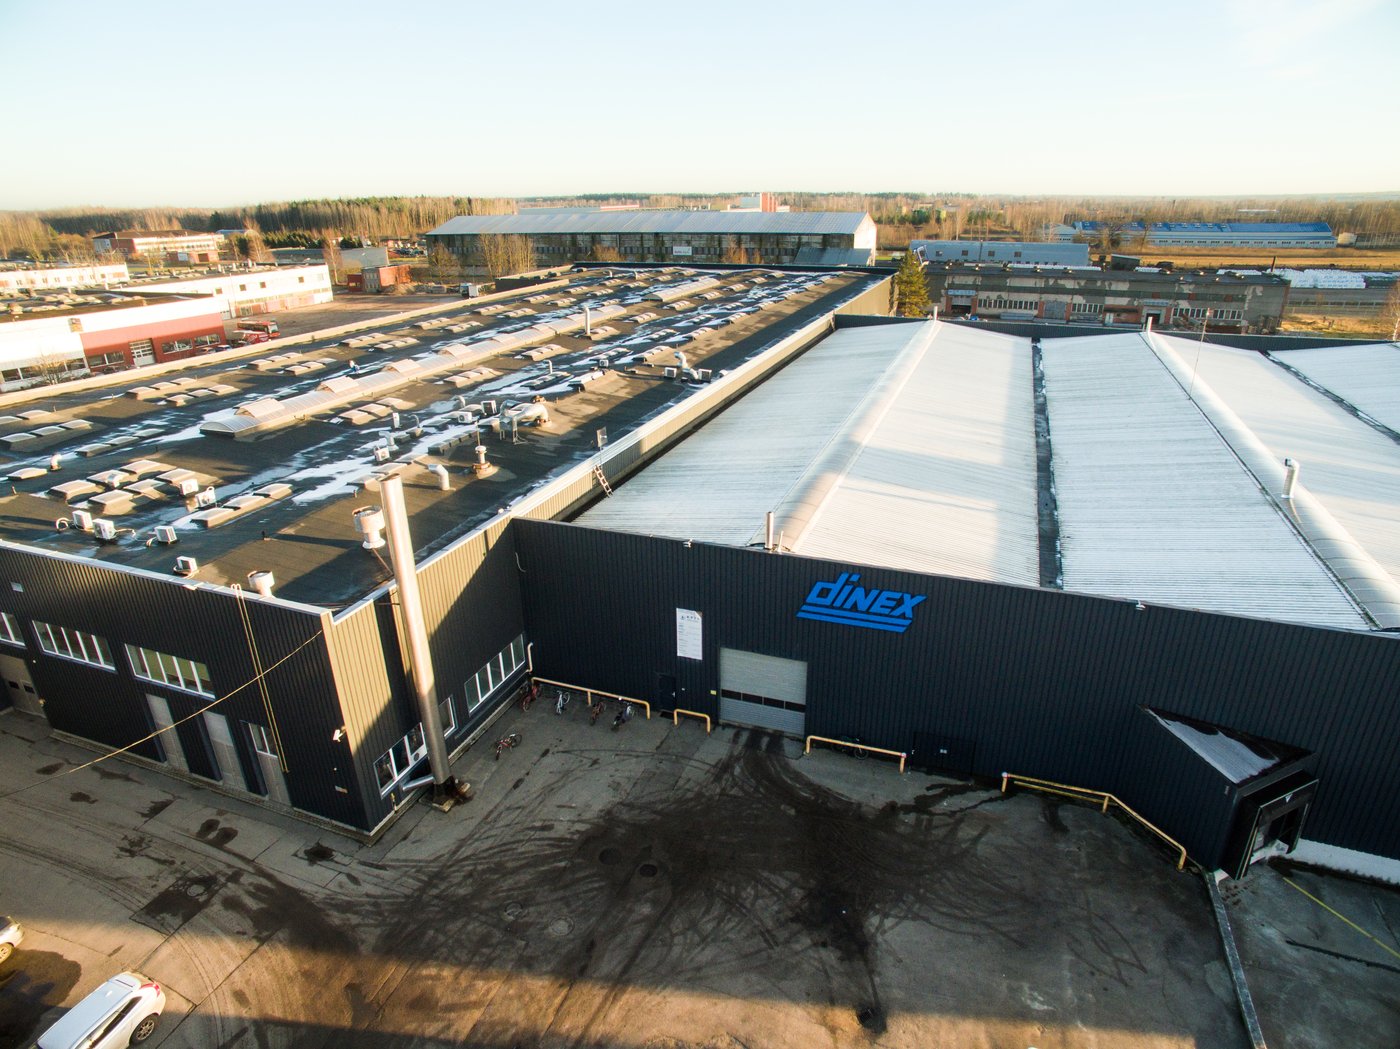
About Dinex Latvia
Dinex Latvia is part of an international group that manufactures exhaust systems for commercial vehicles. Production relies on energy-intensive processes and equipment, including metalworking machinery, ovens, ventilation systems, and compressors. Dinex Latvia qualifies as a large electricity consumer under the Energy Efficiency Law. The company is ISO 50001 certified, and this certification requires it to monitor its energy usage. Detailed monitoring and data-based decisions are part of the plant's daily routine.
Temperature, CO₂ levels, and humidity also matter. They affect employee health and comfort, and they affect the stability of production processes and product quality.
The Challenge
Dinex Latvia knew the plant's total electricity consumption, but not how it was distributed across machines, processes, and production zones. That made it hard to identify the biggest consumers, find the causes of deviations, or measure the real effect of energy efficiency measures.
The team had tried another monitoring solution on selected equipment. It gave some initial insight, but installing the meters and using the system took a lot of time and effort. The dashboard and technical support also fell short, so the solution was not practical to scale across the whole plant.
Microclimate monitoring had similar gaps. It relied on separate local measurements and wall-mounted thermometers with different calibrations, so the readings were not always comparable. There was no central, continuous view of how conditions changed or how they related to production, room occupancy, and ventilation.
The Solution
Dinex Latvia chose AdvanGrid. Before rollout, the two teams held several online and on-site meetings to walk through the production zones, electrical equipment, and possible measurement points together.
Installation was fast and did not significantly disrupt production or employees' daily work. AdvanGrid also stayed responsive after installation, helping with both use of the system and further adjustments.
Measure first, decide later. The plant was first measured with a larger number of sensors to build a complete picture instead of relying on assumptions about which machines use the most. After the first 12 months, the GridMate devices stayed on the equipment where continuous monitoring is most valuable. Today the setup consists of:
- 38 electricity sensors, covering roughly 80% of the plant's electricity consumption
- Total consumption measurement on both of the plant's transformers
- 22 microclimate sensors covering nearly all work zones, tracking temperature, CO₂, and humidity, with automatic alerts to responsible staff when thresholds are exceeded
How Dinex Uses the Data
The plant's electrical engineer uses AdvanGrid data, and the sustainability and environmental management specialist monitors it primarily. Once a week, an energy management working group meets to review weekly and monthly consumption. The group looks at deviations, checks the status of ongoing efficiency tasks, and sets new actions.
The team pays particular attention to microclimate data in relevant seasons, such as summer, when high temperatures are a concern. Automatic notifications let the team assess a situation early and act if needed.
Results
Ventilation turned out to be a major consumer. One of the first findings was that ventilation systems account for a significant share of the plant's electricity use. Operating profiles and consumption outside active production hours showed that their operating modes can be optimized.
Lighting during breaks. Measurements also showed lighting consuming electricity during work breaks. Because break times were already known, Dinex introduced automatic light switch-off in the relevant zones during breaks.
Savings of about 50 kWh per week. A separate lighting measurement point let Dinex check the effect of the change. Comparing consumption before and after, with workdays compared to workdays and weekends to weekends, showed savings of approximately 50 kWh per week. Work on lighting optimization is still continuing.
Faster verification. Dinex can now see quickly whether an energy efficiency measure has reduced consumption. The same approach has been used to evaluate the lighting automation, a change in a drying oven's operating mode, and the replacement of heating elements.
Faster diagnosis. The team can now tell more quickly which machine or zone has a deviation, and whether the cause is production volume, an operating mode, a technical fault, or unnecessary activity outside working hours.
What's Next
- Systematic automatic alerts for unusual consumption, and for exceeded power or process duration limits
- More complete monitoring of electricity, natural gas and fuel consumption
- Making fuller use of humidity data, especially in the welding zone, where high humidity and condensation can affect welding wire storage and weld quality
Advice for Other Manufacturers
"Don't start with an assumption about which machine uses the most. Measure as broad an area as possible first, and only then decide which consumers to monitor permanently."
Data alone doesn't explain every cause. The best results come from combining measurements with the knowledge of process engineers, technical staff and equipment operators. Energy-saving measures should always be weighed against occupational safety, working environment and product quality requirements.
Dinex also highlights AdvanGrid's fast reaction and willingness to help, including when an urgent solution is needed.
Customer Quote
"AdvanGrid helped us see electricity consumption at the level of individual machines and processes. Now we can base energy efficiency decisions on actual measurements, identify deviations faster and verify the results of the improvements we make."